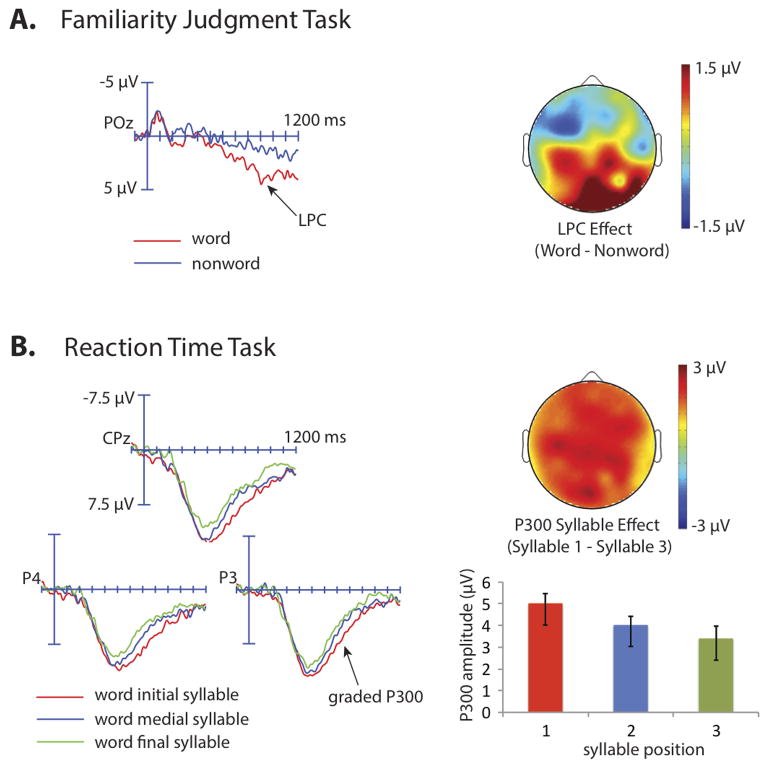
Figure 5.
ERP results from Experiment 2. (A). ERPs timelocked to words and nonword foils in the recognition task. Both correct and incorrect trials are included in these averages. Scalp topography of the late positive component effect, averaged from 700 to 1000 ms, is shown on the right. (B) ERPs timelocked to targets occurring in word initial, word middle, and word final positions in the speeded target detection task. Only correctly detected targets are included in these averages. Scalp topography on the P300 syllable effect, averaged from 400 to 800 ms, is shown on the right. The bar graph displays mean ERP amplitudes across all electrodes as a function of target position. ERPs are filtered at 30 Hz for presentation purposes. Error bars represent SEM.

