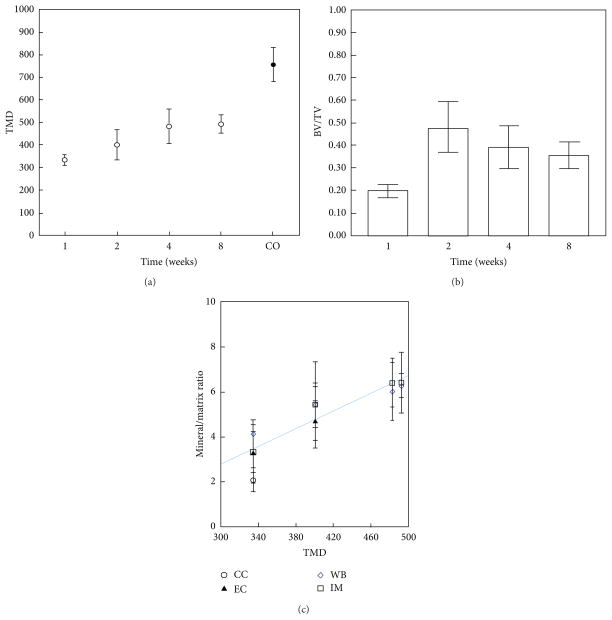
Figure 2.
Microcomputed tomography shows changes in fracture callus with time. (a) Tissue mineral density (TMD; g/cc) increases linearly from weeks 1–4 but never reaches value of cortical bone. (b) Bone volume fraction (BV/TV) decreases from week 2–8. (c) Mineral/matrix ratio as determined by FTIRI in the different regions of the callus correlated with TMD measured at that same point in time.

