
Figure 10.
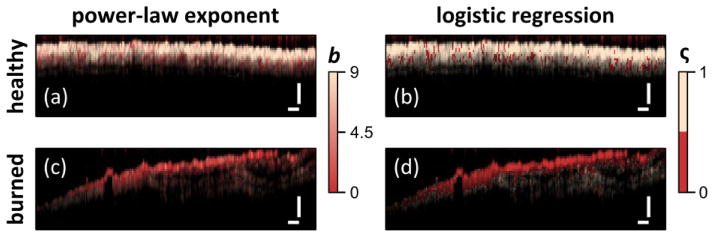
Diagnostic capability of STFT spectral analysis shown by color coding image based on power-law exponent [(a), (c)] or via logistic regression [(b), (d)] for healthy [(a), (c)] and burned tissues [(c), (d)]. Scale bars = 250 μm. [Reprinted with permission from Maher et al., originally published in Optics Letters 39, 5594–5597, (2014).]