
Fig. 2.
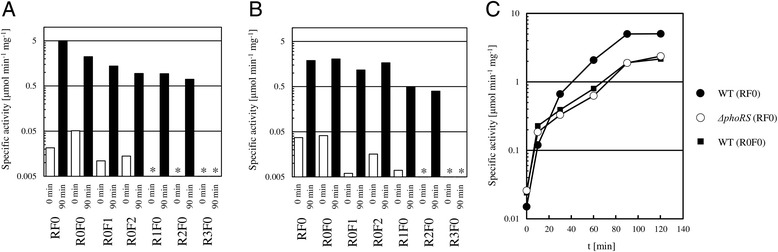
Expression of reporter gene with various promoter fragments in C. glutamicum WT and ΔphoRS. Expression levels of the fusions in C. glutamicum WT (a) and in C. glutamicum ΔphoRS (b). Expression levels of the CAT gene fusions were measured before (open bar) and 90 min (filled bar) after the shift from Pi sufficient to Pi limiting conditions. RF0 to R3F0 indicates the fragment used in the experiment. Expressions are given as specific activity of chloramphenicol acetyltransferase. (*, the specific activity < 0.005) (c) Expression levels of the fusions in a time dependent manner. Expression of fusions was measured after a medium shift to medium lacking Pi. C. glutamicum WT (filled) or ΔphoRS (open) carrying the promoter fragment RF0 (circle) or R0F0 (square) was used