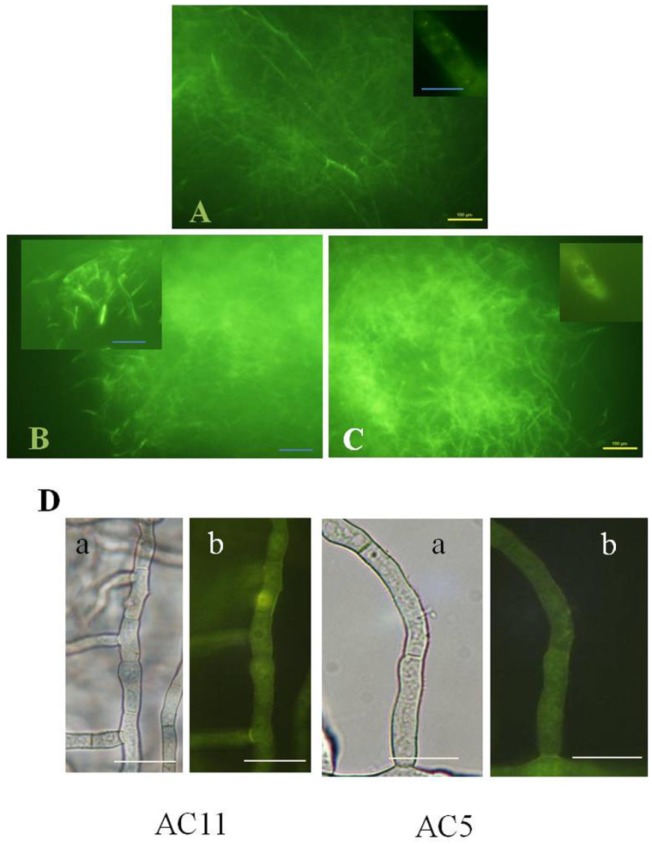
Figure 2.
ROS detection using H2DCFDA in live A. parasiticus AC11 and AC5 hyphae. The strains were grown and stained as described in Figure 1. Small bright dots were detected in the cytoplasm and not in vacuoles. (A) A. parasiticus SU-1; (B) A. parasiticus AC11. Characteristic “scattered bright segment” pattern of staining in cells with bright cytoplasm; the overall brightness of staining in AC11 is higher than in SU-1; (C) A. parasiticus AC5. “Scattered bright segment” staining pattern; bright green small dots surround vacuole (Inset). The overall brightness of staining in AC11 and AC5 is higher than in SU-1. Bar, 100 µm; (D) Autofluorescence of A. parasiticus AC5 and AC11 strains used in the study observed in the absence of staining by H2DCFDA: (a), bright field image; (b), image obtained under fluorescence microscope. Bar 100 µm.

