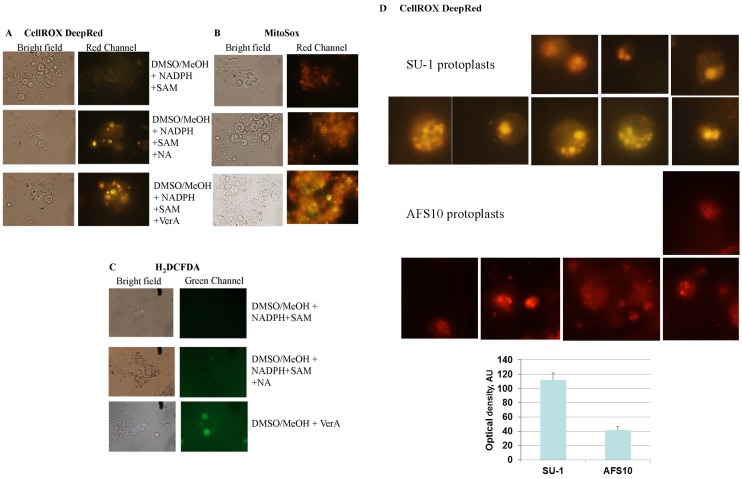
Figure 3.
Feeding aflatoxin pathway intermediates to protoplasts stimulates intracellular ROS accumulation. Isolation and feeding of protoplasts were performed as described in Materials and methods. After feeding with NA and VerA the protoplasts were stained with CellROX Deep Red (A), Mitosox (B), and H2DCFDA (C), and visualized under a fluorescent microscope as described in Methods; (D) Comparison of the fluorescence intensity in SU-1 and AFS10 protoplasts stained with CellROX. SU-1 and AFS10 protoplasts were fed with VerA and stained using CellROX, as described in above. The images of individual protoplasts are presented in grayscale mode for assessment of the fluorescence intensity. For the graph the fluorescence intensity was assessed using ImageJ 1.48v software (NIH, Bethesda, MD, USA). AU, arbitrary units. Data are presented as the Mean ± SE, N = 6.

