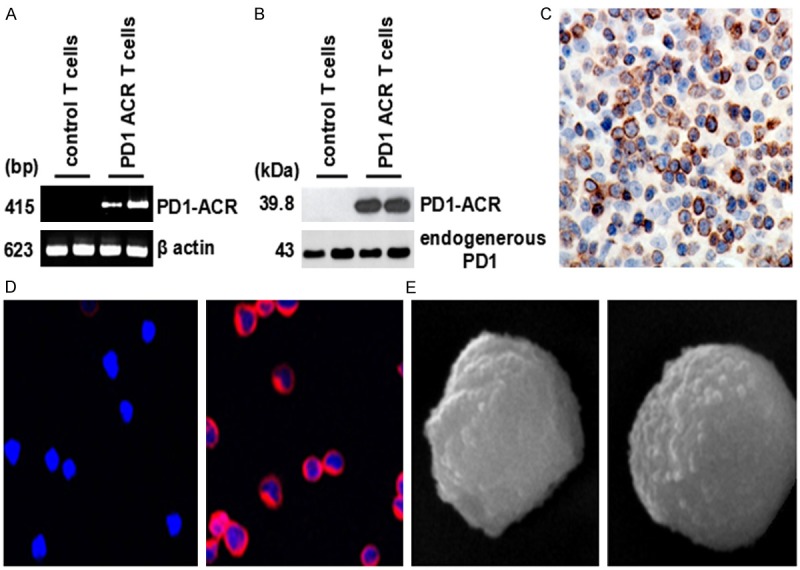
Figure 2.

Transduction efficiency of PD1-ACRs and the phenotypic profile of T cells. A. RT-PCR analysis showed the transduction efficiency of the PD1-ACR lentiviral vectors (right) versus a negative control of untransduced T cells (left). B. The expression of ACRs in activated primary T cells transduced with PD1-ACR vectors was assessed by Western blot. C. Confocal laser scanning microscope (CLSM) indicated the percentage of cells positive for PD1-ACR (1000 × magnification) was up to 99.8%. D. The PD1-ACR T cells have no significant change in cell morphology. E. Smoother topography was observed in comparison to the control T cells by SEM (8500 × magnification).
