FIG. 2.
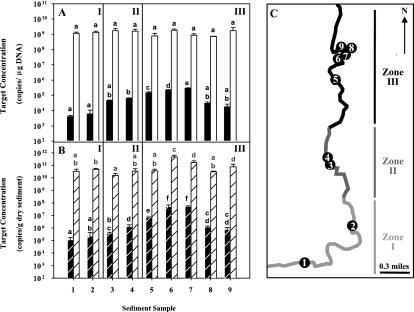
Molecular analysis of sediment samples. (A) Copies of target per microgram of DNA of the nagAc-like gene (black bars) and bacterial 16S rRNA gene (white bars) in Chattanooga Creek sediment samples. (B) Copies of target per gram dw of sediment of the nagAc gene (black bars with white stripes) and bacterial 16S rRNA gene (white bars with black stripes). Values of copies of the target per gram dw were corrected by DNA recovery calculated based on real-time PCR quantification of the spiked luxE gene, as indicated in Materials and Methods. Letters above bars indicate homogeneous subsets by the multiple-comparison Tukey (b) post hoc tests of untransformed data (copies of the nagAc-like gene per microgram of DNA) or log10-transformed data (copies of the nagAc-like gene per gram dw and copies of the 16S rRNA gene per microgram of DNA or per gram dw). Error bars indicate the standard deviations of values measured in triplicate DNA extractions. (C) Map of sampling area. I to III represent different segments of the creek. Zone I, background section upstream of the contaminated area of the creek (sampling sites 1 and 2); zone II, remediated section of Chattanooga Creek (sampling sites 3 and 4); zone III, section of the creek considered for remediation (sampling sites 5 to 9). Arrow, direction of the creek, as well as north (N).

