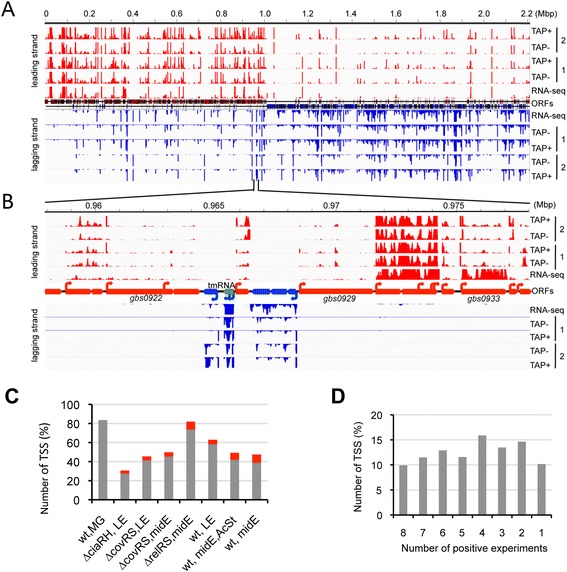
Figure 1.

Characterization of transcription start sites in S. agalactiae. A. Visualization of sequence reads mapped to the genome of strain NEM316 in conditions of dRNA-seq: strand-specific sequencing of transcript 5′ ends with (TAP+) and without (TAP-) TAP treatment, and strand-specific RNA-seq. Two dRNA-seq experiments are shown corresponding to 1: RNA from multiple growth conditions (MG sample); 2: RNA from a ∆covRS mutant grown to mid-exponential phase. The RNA-seq library was prepared with the wt strain at mid-exponential phase. B. Detailed view of the 958000–978000 region. Protein coding genes annotated on the (+) and (−) strands are indicated by red and blue large arrows. TSSs are depicted as small arrows. Based on dRNA-seq and RNA-seq data, a transcript corresponding to a ncRNA (srn040/tmRNA) was annotated and is shown as a large green arrow. C. Proportions of the total TSSs detected under each experimental condition. Grey: TSSs detected with RNA from multiple growth conditions (wt, MG); red: TSSs not detected in wt, MG. MG: mixture of growth conditions; LE: late exponential phase; midE: mid-exponential growth phase; AcStr: acid stress. D: Proportions of TSSs according to the number of experiments in which they were detected.
