
Figure 6.
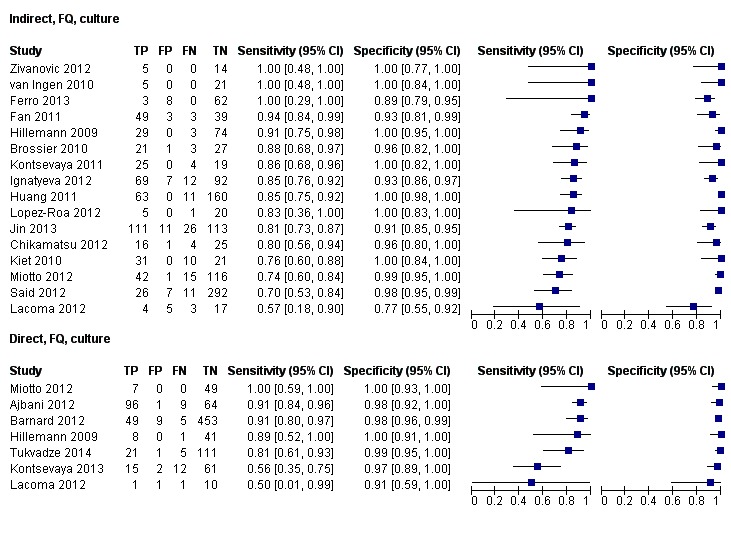
Forest plots of MTBDRsl sensitivity and specificity when performed indirectly or directly for FQ resistance detection and using phenotypic culture-based DST as a reference standard. The individual studies are ordered by decreasing sensitivity. TP = true positive; FP = false positive; FN = false negative; TN = true negative. Values between brackets are the 95% CIs of sensitivity and specificity. The figure shows the estimated sensitivity and specificity of the study (blue square) and its 95% CI (black horizontal line).