
Figure 19.
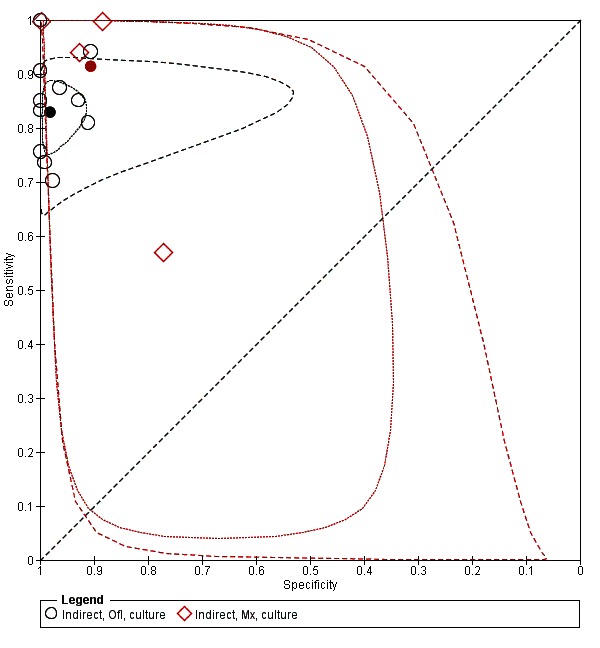
Summary plots of MTBDRsl sensitivity and specificity comparing direct detection of resistance for ofloxacin (Ofl) and moxifloxacin (Mx) using culture as a reference standard. The solid circles correspond to the summary estimates of sensitivity and specificity and are shown with 95% confidence regions (dotted lines) and 95% prediction regions (dashed lines).