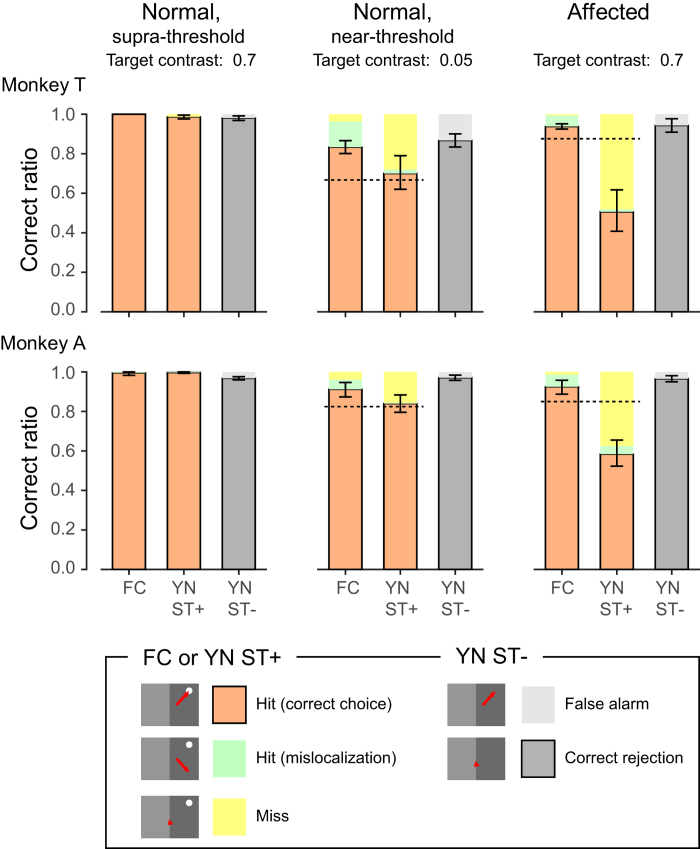
Figure 3. Performance of FC task and YN task.
The bars with black edges indicate the ratio of correct, rewarded trials to the total trials. See the text for classification of trials according to the behavioural responses. FC, FC task. YN ST+, ST+ condition of YN task. YN ST−, ST− condition of YN task. Left panel, trial blocks in which supra-threshold stimuli (target contrast 0.7) were presented in the normal hemifield (“Normal, supra-threshold”). Middle panel, trial blocks in which near-threshold stimuli (target contrast 0.05) were presented in the normal hemifield (“Normal, near-threshold”). Right panel, trial blocks in which stimuli (target contrast 0.7) were presented in the affected hemifield (“Affected”). Probability of ST+ trials (“p” in Fig. 2) was fixed at 30%. Top, monkey T. Bottom, monkey A. Dotted lines: Performance of the YN ST+ condition (PYN) expected from that of the FC condition (PFC): PYN = PFC * 2–1.

