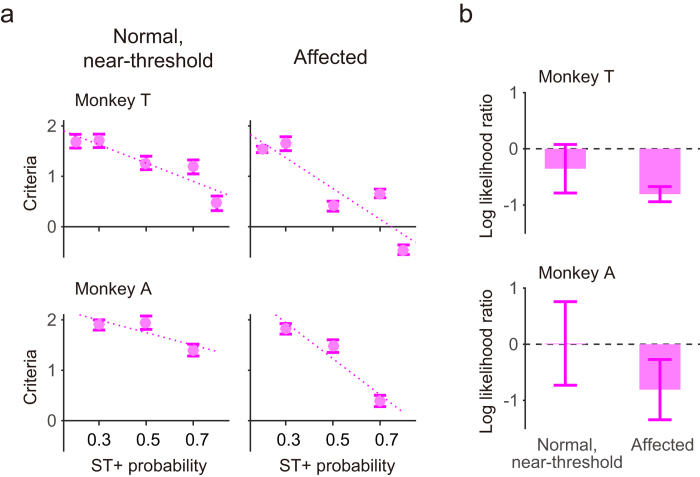
Figure 5. Decision bias in the YN task.
a The decision criterion for the YN task (with reference to the noise level in signal detection theory) was plotted across the ST+ probability. In all cases, the correlation coefficients were smaller than −0.81. The error bars indicate the standard deviation. b The log likelihood ratio at the criterion with 50% ST+ probability was plotted for both monkeys and two stimulus conditions. The value zero indicates optimal decision and the negative values indicate bias toward saccades over fixation. Error bars indicate the standard deviation.

