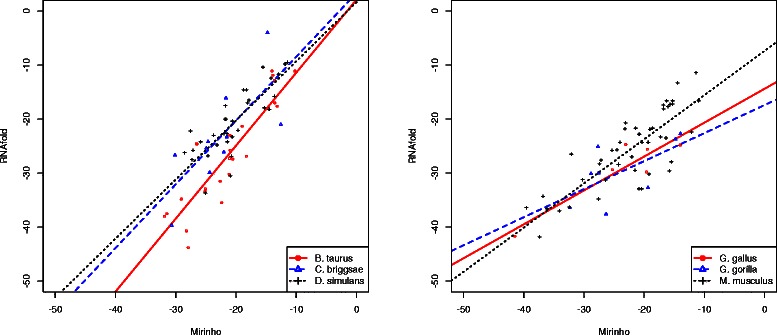
Figure 4.

Regression analysis. Regression analysis of the energies predicted by MIRINHO and RNAFOLD. On the left, chromosome 25 of B. taurus, chromosome I of C. briggsae, chromosome 2R of D. simulans. On the right, chromosome 25 of G. gallus, chromosome 22 of G. gorilla, chromosome 19 of M. musculus.
