
Figure 11.
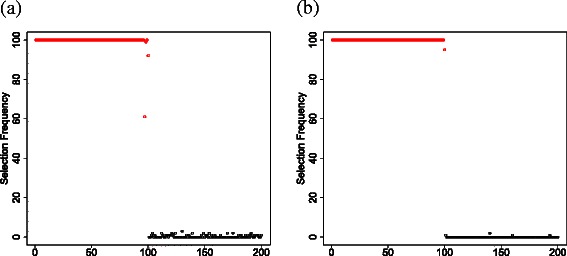
Frequency of 100 probes selected by CPCAFE and also identified by VBPCAFE within the 100 top-ranked probes with largest values over 100 independent ensembles.(a) miRNA; and (b) mRNA. Red and black circles correspond to probes selected or not selected, respectively, by CPCAFE.