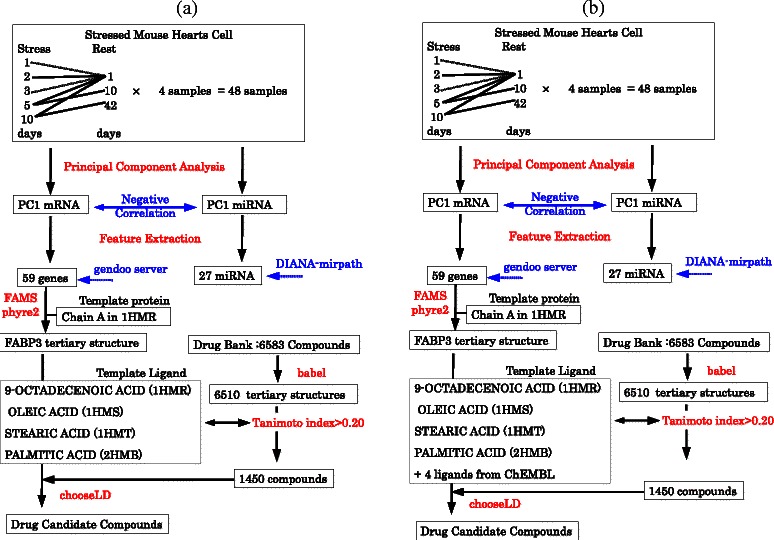
Figure 16.

Overall study work flow. The methods used for data processing and evaluation are indicated in red and blue, respectively. Dotted lines in sample descriptions (i.e., 1 or 2 day(s) stress vs 1 day rest) indicate missing control samples (see Methods for more detail).
