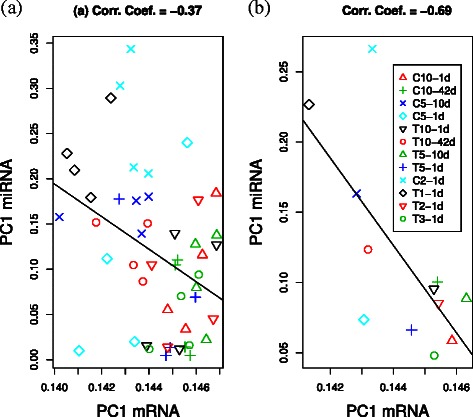
Figure 9.

Comparison of sample contributions to PC1 between mRNA and miRNA.(a) Scatterplot comparing mRNA and miRNA expression profiles for sample contribution to PC1 (i.e., components of the first loading vector). Pearson’s correlation coefficient =−0.37 (P=0.01). (b) Averaged contributions within each condition. Pearson’s correlation coefficient =−0.69 (P=0.01). XY-Zd with X = C (control); X = T (treatment); Y, stress days; and Z, rest days in experimental conditions. See Additional file 2 for more detail.
