
Figure 5.
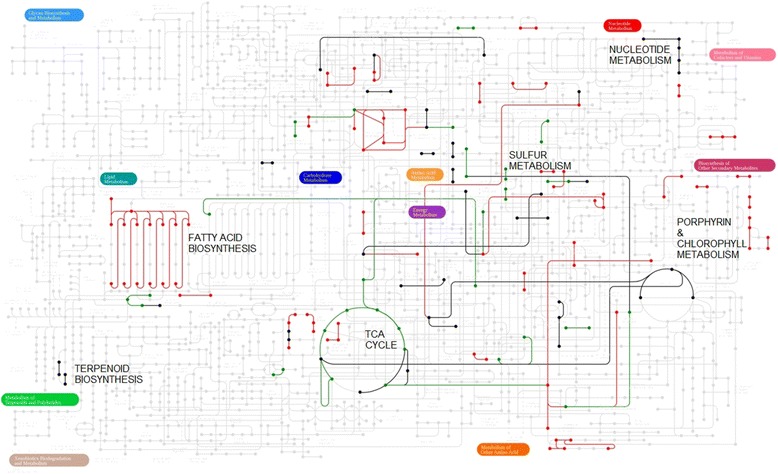
Highlighting enzymes from three gene groups on top of the generic KEGG metabolic pathway. Genes were classified into three groups (black, red and green) according to their clustering pattern at the metabolites versus genes correlation matrix (Figure 4). Following mapping gene accessions to ECs (Methods), only ECs that were classified into a single gene group were further highlighted.