
Fig. 3.
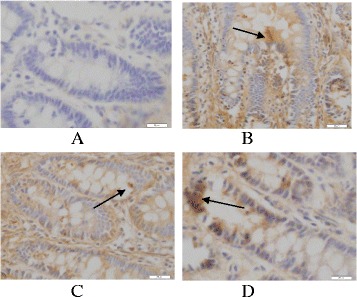
The intestinal mucosal cell apoptosis in the each group after treatment (TUNLE staining, 10 × 40). Note: a The pathological changes of liver tissue in normal group; b The pathological changes of liver tissue in Model group; c The pathological changes of liver tissue in Glutamine treatment group; d The pathological changes of liver tissue in BA treatment group