
Fig. 2.
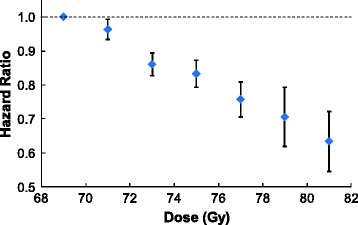
Hazard ratios for overall survival by dose group on multivariate analysis. Adjusting for the effect of other factors, hazard ratios for overall survival declined monotonically with increasing dose. Diamonds correspond to the observed hazard ratio for each dose group. The error bars indicate the standard error of the hazard ratio