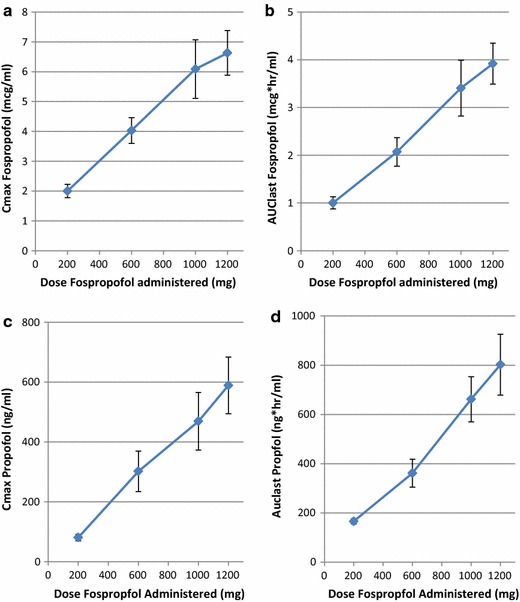
Figure 5.

Pharmacokinetic parameters of AUClast and Cmax for fospropofol (b and a) and propofol (d and c) following oral administration of placebo or fospropofol at 200, 400, 600, 1,000 and 1,200 mg in human subjects (n = 10). Each subject received each of the doses. In general, dose proportional plasma concentrations of both fospropofol and propofol were observed. Data shown as mean ± SEM.
