
Figure 2.
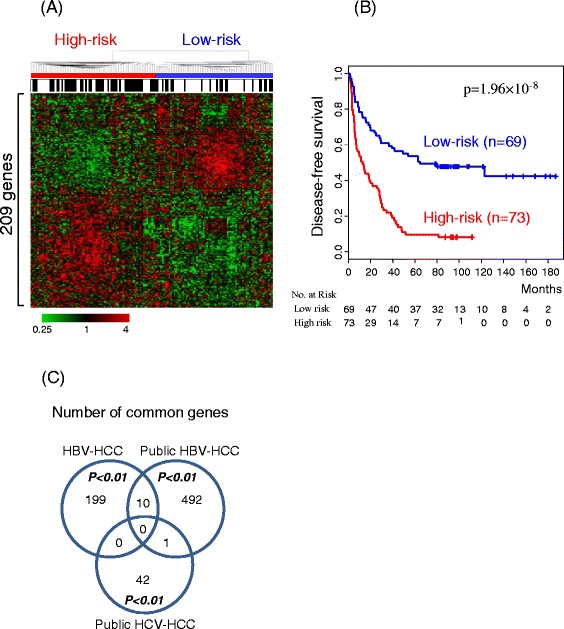
Cluster analysis of recurrence-related genes. (A) Dendrogram of clustering pattern measured from the matrix of 209 recurrence-associated genes (Cox regression p-value < 0.01) from our HBV-HCC. Samples were classified into two subgroups: low-risk and high-risk based on recurrence outcome. The black bar indicates patients with early recurrence within 2 years after surgery. Columns represent individual samples, and rows genes. Red and green colors reflect high and low expression levels, respectively, as indicated by scale bars. (B) Kaplan-Meier plots for recurrence rates of the low- and high-risk subgroups. P-values were obtained using the log-rank test. (C) Overlap of recurrence-associated genes (Cox regression p-value < 0.01) among datasets.