
Fig. 4.
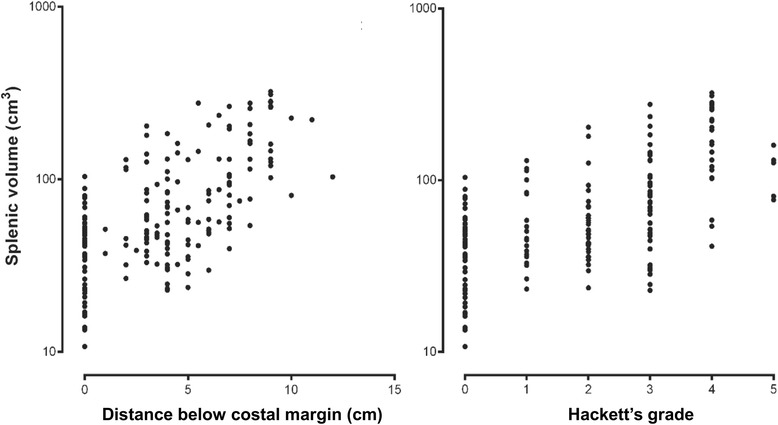
Splenic volume by ultrasound plotted on a logarithmic scale against longitudinal distance in cm below the costal margin (left) and Hackett’s grade (right) in children with moderate or severe malarial anaemia
Official websites use .gov
A
.gov website belongs to an official
government organization in the United States.
Secure .gov websites use HTTPS
A lock (
) or https:// means you've safely
connected to the .gov website. Share sensitive
information only on official, secure websites.
Splenic volume by ultrasound plotted on a logarithmic scale against longitudinal distance in cm below the costal margin (left) and Hackett’s grade (right) in children with moderate or severe malarial anaemia