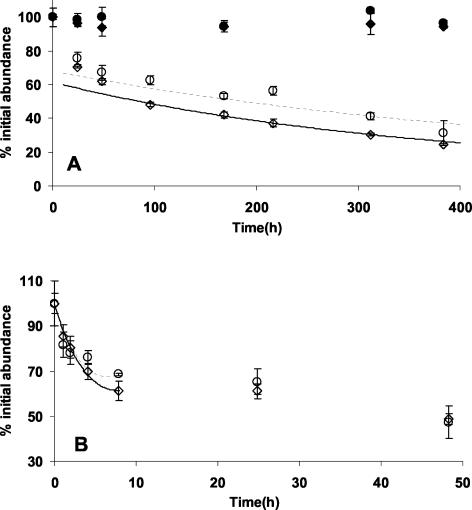
FIG. 2.
Percentages of the initial virus abundance for 0.5% glutaraldehyde-fixed (⋄) and 2.0% formaldehyde-fixed (○) samples collected from Jericho Beach Pier and stored at 4°C. Subsamples were collected over time, and the viruses were enumerated by using SYBR Green I staining. The percentages of the initial virus abundance estimates are shown over time for slides prepared immediately and frozen at −20°C for 0.5% glutaraldehyde-fixed (⧫) and 2.0% formaldehyde-fixed (•) samples. Models of decay for glutaraldehyde- and formaldehyde-fixed samples are indicated by solid and dashed lines, respectively (see text for equations). (A) Long-term experiment conducted over 16 days. (B) Short-term experiment conducted over 48 h. The error bars indicate standard deviations for triplicate samples.

