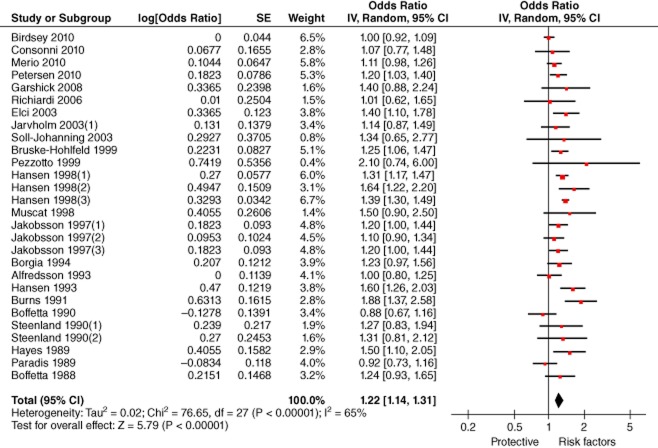
Figure 7.
Forest plot of the risk of lung cancer among professional drivers (pooled effect sizes of incidence and mortality).Note: Jarvholm and Silverman34 reported effect sizes of both lung cancer incidence and mortality, but we only included incidence data in this figure, noted as Jarvholm and Silverman34 (1). CI, confidence interval.

