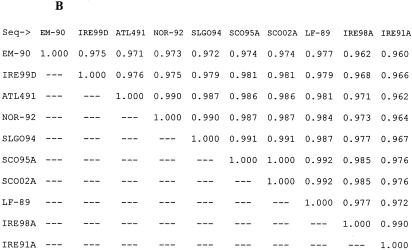
FIG. 2.
Sequence identity matrices drawn from aligned sequences. The matrices show the proportion of identical residues between all of the sequences in the alignment. The reported number represents the ratio of identities to the length of the longer of the two sequences after positions at which both sequences contain a gap are removed. (A) ITS matrix comparing sequences of 287 nucleotide positions. (B) 16S matrix comparing sequences of 1,309 nucleotide positions.


