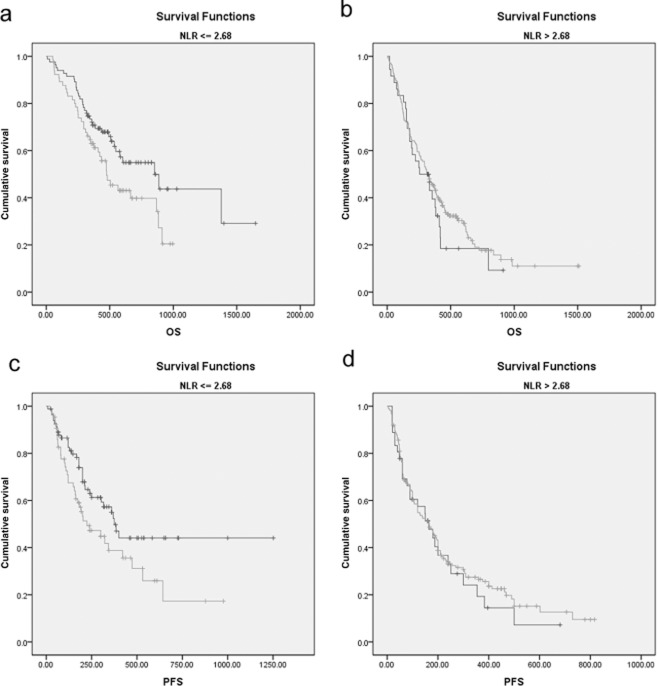
Figure 4.
Kaplan–Meier survival curves stratified by a combination of neutrophil to lymphocyte ratio (NLR) and platelet to lymphocyte ratio (PLR) in non-small cell lung cancer patients. (a) Overall survival (OS) stratified by PLR when NLR is ≤2.68; (b) OS stratified by PLR when NLR is > 2.68; (c) progression-free survival (PFS) stratified by PLR when NLR is ≤2.68; and (d) PFS stratified by PLR when NLR is > 2.68.  , PLR <= 119.50;
  , PLR > 119.50;
  , PLR <= 119.50-censored;
  , PLR > 119.50-censored.

