FIG. 8.
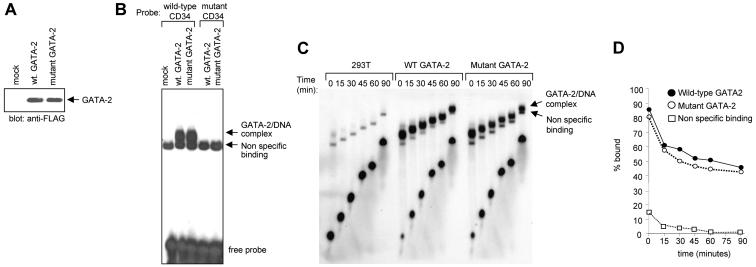
Comparison of wild-type (wt) and mutant GATA-2 DNA-binding activities. (A) Western blot analysis of 293T cell extracts programmed by transient expression of Flag-tagged versions of wild-type GATA-2 and the mutant GATA-2 defective in the ability to interact with RARα. (B) EMSA analysis with radiolabeled oligonucleotide probe harboring a GATA motif from the murine CD34 enhancer region. Note the presence of a nonspecific DNA-binding activity that is variably seen in 293T cell nuclear extracts. (C) Dissociation assays with control 293T cell extracts or extracts programmed by expression of wild-type or mutant GATA-2. Note the presence of a nonspecific DNA-binding activity. (D) Quantitative analysis of the results presented in panel C. The percentage of probe bound by GATA-2 is plotted on a log scale versus time.

