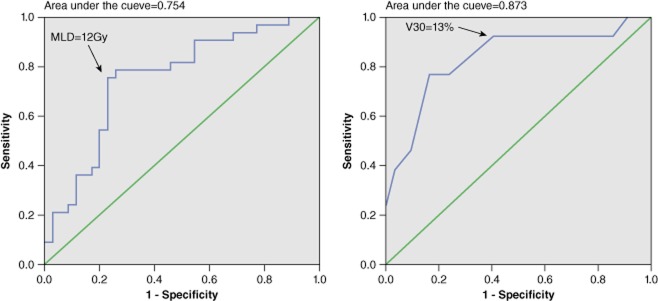
Figure 1.

(a) Receiver operating characteristics (ROC) curve for mean lung dose (MLD) to predict acute radiation pneumonitis (ARP); black arrow shows the predicted optimal MLD threshold for ARP. (b) ROC curve for V30 to predict severe acute radiation pneumonitis (SARP); black arrow shows the predicted optimal V30 threshold for SARP.
