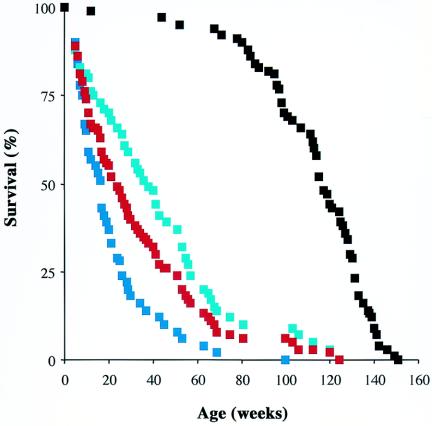
FIG. 3.
Reduced survival of Trex1 null mice. Survival curves are shown for all Trex1−/− mice in this study (n = 110; red curve) and for the wild-type Trex1+/+ controls (n = 77; black curve). For those Trex1−/− mice that were born to heterozygous (n = 51; dark blue curve) or homozygous null (n = 59; light blue curve) mothers, the difference in median survival of 21 weeks was significant (log rank test with 95% confidence interval; P < 0.0001).

