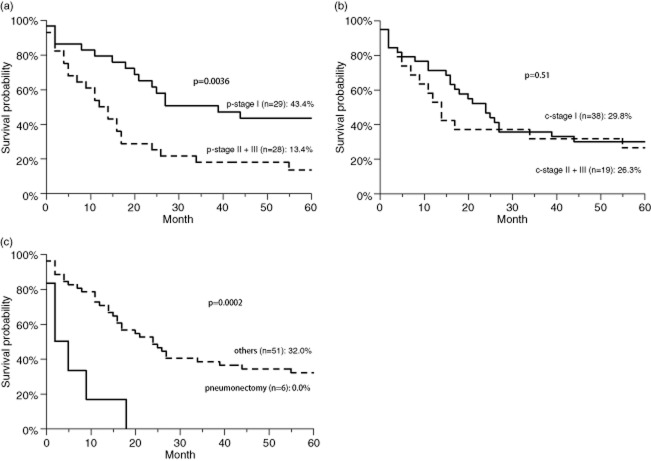
Figure 3.
The results of the Kaplan-Meier survival analysis. (a) The survival curves of patients with p-stage II or III versus p-stage I disease.  , p-stage I;
  , p-stage II + III. (b) The survival curves of patients with c-stage II or III versus c-stage I disease.
  , c-stage I;
  , c-stage II + III. (c) Pneumonectomy versus other surgical procedures.
  , pneumonectomy;
  , others.

