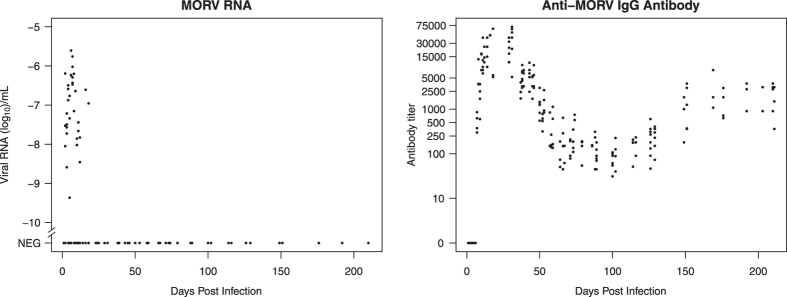
Figure 2.

Anti-MORV IgG antibody and MORV RNA levels in blood. Note the different Y-axis limits. Relative RNA levels are log-transformed (log10 [RNA level]) to improve plot interpretation. A value of -6 corresponds with the RNA level of a 10−6 dilution of the standard RNA (used for relative quantification) extracted from a 106 FFU/mL virus stock, and would thus correspond with a concentration of 1 FFU/mL. RNA results originating from blood stored on filter paper and in capillaries were pooled for plotting purposes.
