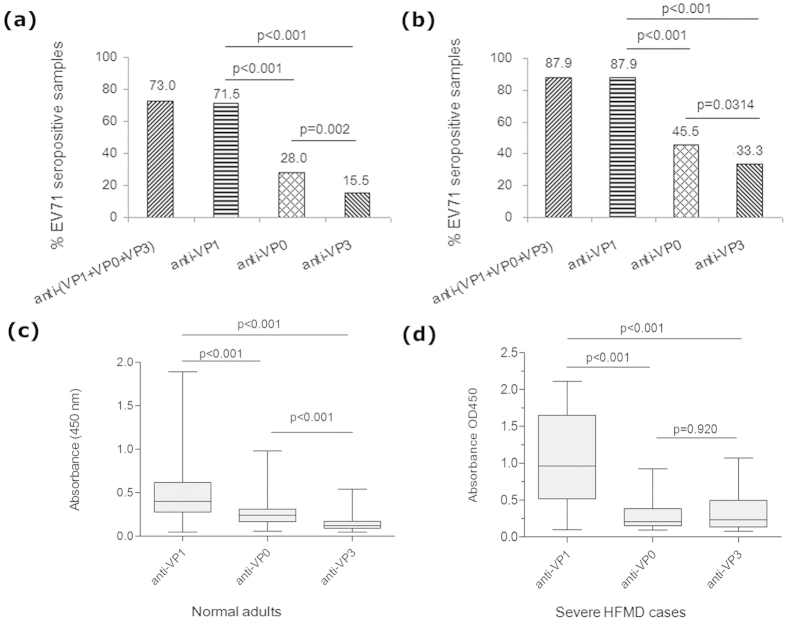
Figure 3.
Characterization of the antibody responses to EV71 capsid proteins in 200 normal adults and 33 severe HFMD cases. The positive rate of antibody response was plotted on the y-axis against the three antigens plotted on the x-axis. The positive rate corresponding to the anti-(VP0 + VP1 + VP3) represented the total positive rate of antibody responses detected using EV71 VP0, VP1 and VP3 in 200 normal adults (a) and 33 severe HFMD cases (b). A comparison of the antibody reactivity against EV71 capsid VP0, VP3 and VP1 in 200 normal adults (c) and 33 severe HFMD cases (d). The boxes represent the interquartile range, the line inside each box represents the median of the samples and the whiskers represent the range of the data.

