
Figure 2.
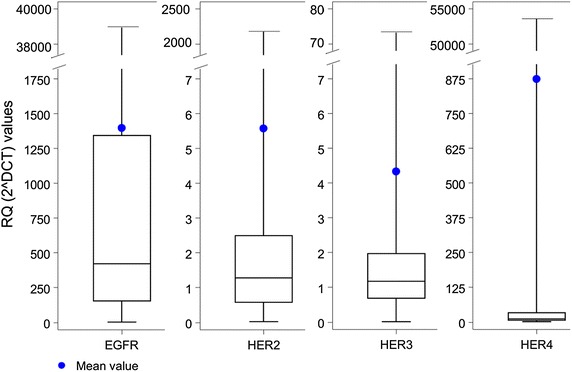
Distribution of relative expression values of mRNA encoding for HER family receptors. The 2 to the power of DCT method was used for data calculation. CT cycle threshold, DCT delta CT, RQ relative quantification.
Official websites use .gov
A
.gov website belongs to an official
government organization in the United States.
Secure .gov websites use HTTPS
A lock (
) or https:// means you've safely
connected to the .gov website. Share sensitive
information only on official, secure websites.
Distribution of relative expression values of mRNA encoding for HER family receptors. The 2 to the power of DCT method was used for data calculation. CT cycle threshold, DCT delta CT, RQ relative quantification.