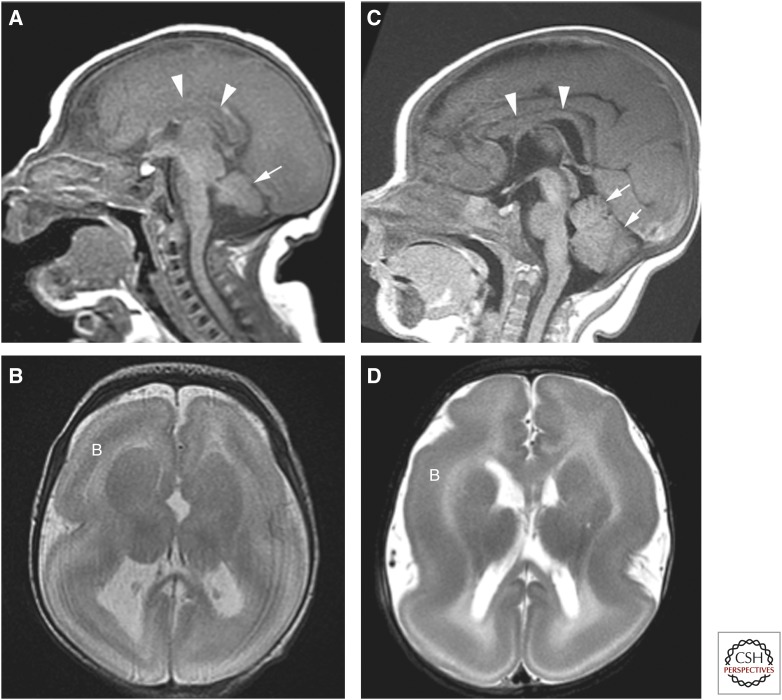
Figure 3.
Lissencephaly secondary to TUBA1A (A,B) and LIS1 (C,D) mutations. Note that the child with the TUBA1A mutation is smaller, the corpus callosum (arrowheads) is thinner (difficult to see), and the cerebellum is small. Both are characterized by a band (B) of incompletely migrated neurons deep to the cortex.

