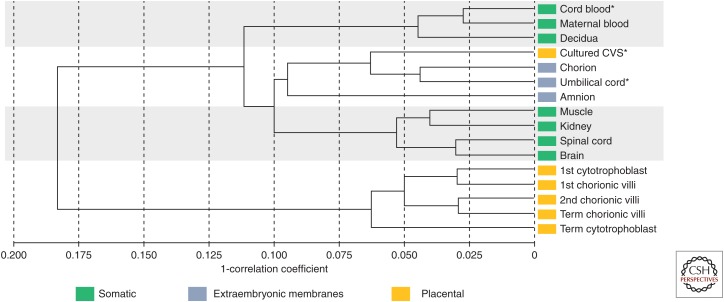
Figure 1.
Correlation dendrogram of DNA methylation at 473,369 CpG sites. Correlation dendogram using Illumina HumanMethylation450 BeadChip data filtered for X and Y chromosome probes, probes cross-hybridizing to the X or Y, probes with SNPs in the target CpG site and probes that could not be distinguished from the background signal (detection p value >0.05). Sample sizes for each tissue group are: 3 female cord blood, 10 maternal blood, 3 decidua, 6 female cultured CVS (chorionic villus sampling), 3 female and 3 male umbilical cord, 3 male amnion, 7 female and 6 male muscle, 8 female and 7 male kidney, 4 female and 5 male spinal cord, 6 female and 5 male brain, 4 FACS-sorted cytotrophoblast, 2 female and 3 male first trimester chorionic villi (<13 wk gestation), 8 female and 6 male second trimester chorionic villi (≥13 to <24 wk gestation), 10 female and 11 male term chorionic villi (≥37 wk gestation), 5 density-gradient separated term cytotrophoblast. *Indicates a pooled sample of several individuals. Colored labels indicate the origin of each tissue.

