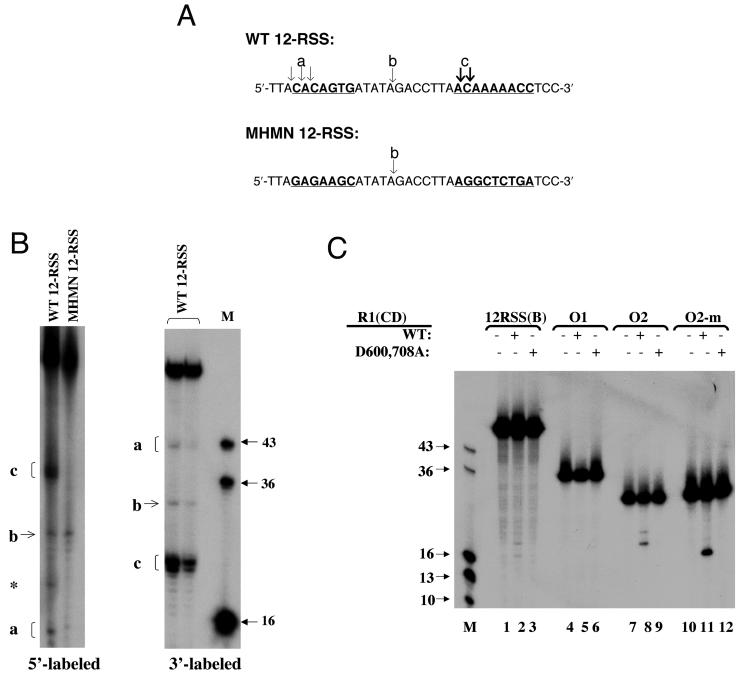
FIG. 2.
Pattern of ss DNA cleavage by R1(N+CD) and R1(CD). (A) Sites of cleavage on the top strands of WT 12-RSS (5′ and 3′ labeled) and MHMN 12-RSS (5′ labeled). The conserved heptamer and nonamer sequences in WT 12-RSS and the corresponding sequences in MHMN 12-RSS are underlined and indicated in bold letters. Arrows indicate the sites of cleavage. The bold arrows indicate enhanced cleavage. The labels a, b, and c correspond to the DNA products in panel B. (B) The left autoradiogram illustrates cleavage of 5′-labeled ss WT 12-RSS (top) and ss MHMN 12-RSS (top) by 30 μg of R1(CD)/ml. A band in the WT substrate that is independent of protein is marked with an asterisk. The right autoradiogram illustrates cleavage of 3′-labeled ss WT 12-RSS (top) by 30 and 15 μg of R1(CD)/ml in the first and second lanes, respectively. (C) Cleavage of the following 5′-labeled substrates: ss WT 12-RSS(B), O1, O2, and O2-m by 30 μg of WT and D600,708A R1(CD)/ml. In panels B and C, M indicates the marker lane with the lengths (in bases) of each marker indicated.

