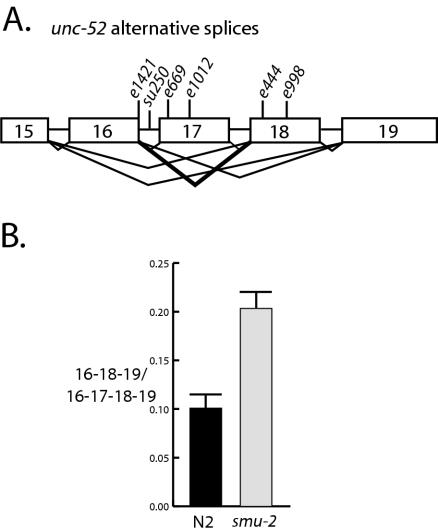
FIG. 1.
RT-PCR analysis of unc-52 transcripts in smu-2 mutants. (A) Depiction of the alternatively spliced region of unc-52. Boxes, exons 15 to 19; horizontal lines, introns. The locations of unc-52 viable mutations used in this study are indicated. The heavy lines from exon 16 to exon 18 indicate the alternatively spliced transcript that shows increased abundance in smu-2 mutants. (B) Results from four independent RT-PCR experiments performed on smu-2(mn416) and wild-type (N2) larvae. The mean ratios of 16-18-19/16-17-18-19 unc-52 transcripts were 0.100 ± 0.015 in wild-type (N2) larvae and 0.204 ± 0.018 in smu-2 larvae; these values were found to be significantly different in a paired t test (P = 0.025). These data indicate that there is approximately a twofold increase in the 16-18-19 transcript in smu-2 mutants.

