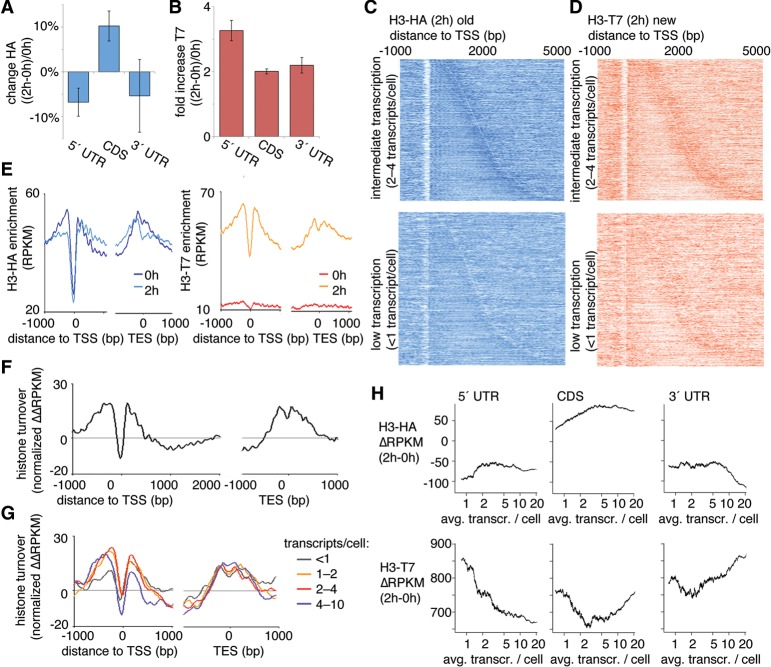
Figure 2.
Transcription-dependent nucleosome turnover is related to the position of nucleosomes within genes. (A,B) ChIP was used to measure nucleosome stability using HA epitope-tagged H3 (H3-HA; transcribed before the RITE switch) (A) or T7 epitope-tagged H3 (H3-T7; transcribed after the RITE switch) (B) in different regions of the transcript (5′ UTR, CDS, and 3′ UTR). Measurements were compared before (0 h) and after (2 h) β-estradiol addition. Bars show the average of two independent ChIP-exo experiments, and the error bars represent the range. (C,D) Heatmaps of nucleosomes at 2 h aligned at the transcription start site (TSS) for H3-HA (C) and H3-T7 (D). The top panels show genes that are expressed at intermediate levels (two to four transcripts per cell), and the bottom panels show genes with less than one transcript per cell. Short transcripts are found at the top of each panel and long transcripts are found at the bottom. The ChIP signal (RPKM for each 10 bp) is represented by color intensity. The white line marks the borders of the transcribed units. (E) Averaged ChIP signals (RPKM for each 10 bp) for epitope-tagged H3 aligned at the TSS and for all transcribed units in the genome. (F,G) The histone turnover score (normalized ΔΔRPKM) aligned at the TSS and transcription end site (TES) for all transcribed genes (F) and stratified according to transcription levels (G). (H) Average ChIP signal per transcribed unit for the H3-HA (old H3, top) and H3-T7 (new H3, bottom) ΔRPKM (2–0 h) according to the number of transcripts per cell. The running averages (window 500) are plotted against the average transcript levels within the window.

