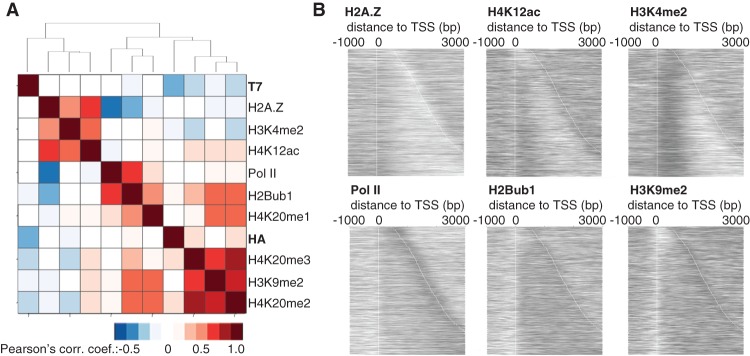
Figure 3.

Correlation between chromatin modifications and nucleosome turnover. (A) Hierarchical clustering of the correlation coefficients from the ChIP signals for 150-bp genomic fragments. All ChIP-microarray samples were normalized to input (log2). In the ChIP-exo turnover data, i.e., H3-HA (RITE) and H3-T7 (RITE), data from the 2-h samples are relative to the 0-h time point. (B) Heatmaps of the ChIP signals (log2) from the antibody against indicated protein/protein modification at genes that were expressed at intermediate levels (two to four transcripts per cell).
