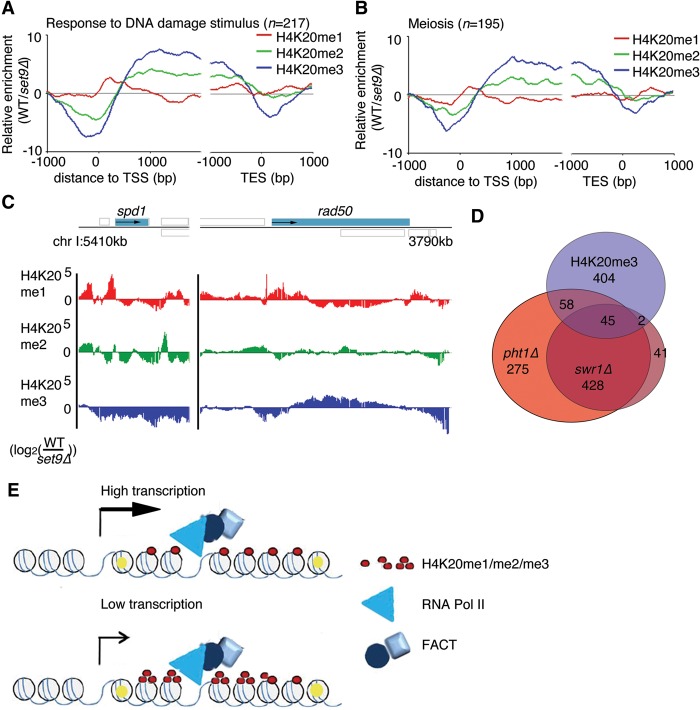
Figure 5.
Subsets of inducible genes are associated with H4K20me3. (A) The average H4K20me ChIP signals in genes returned using the gene ontology terms “Response to DNA Damage Stimulus” and (B) “Meiosis” aligned according to the TSS. (C) ChIP data of the different H4K20 methylations (me1/me2/me3) at the spd1 and rad50 loci. Gray boxes indicate annotated features transcribed to the right (above solid line) or left (below solid line). (D) Venn diagram shows the overlap between genes associated with H4K20me3 (log2 [WT/set9Δ] > 0.5) and genes that are down-regulated in pht1Δ and swr1Δ cells. (E) A model of the relationship between transcription and FACT-mediated nucleosome recycling. High-turnover nucleosomes are marked in yellow.

