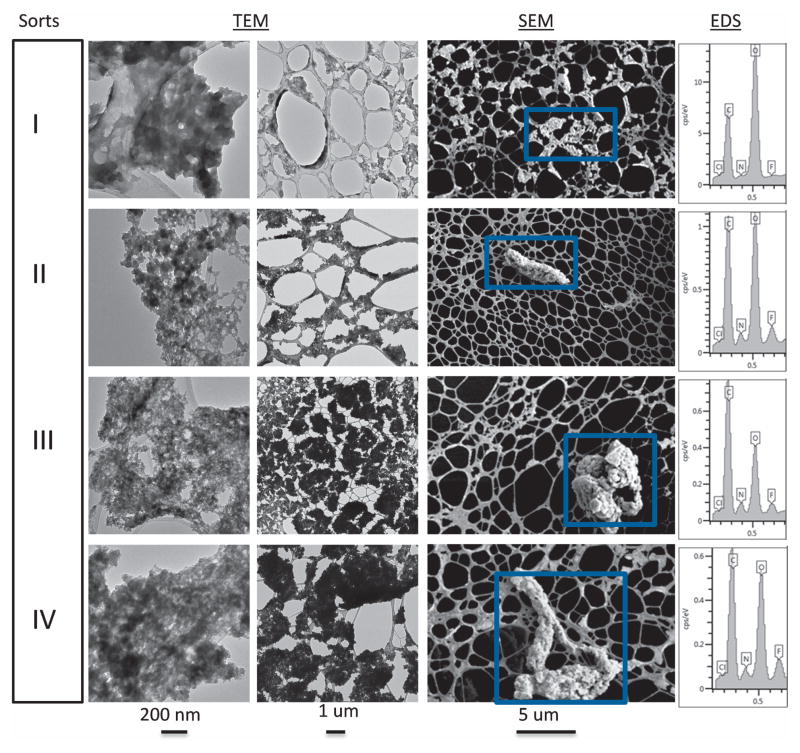
Figure 8.
Representative TEM (200 nm and 1 μm resolution) and SEM (5 μm resolution) images of mAb2 particles of four different FACS sorted samples (Sort I, II, III, IV). The SEM particle images (representative graphs shown here), selected by the blue boxes, were also analyzed for their elemental composition by EDS as shown in far right column of the figure.

