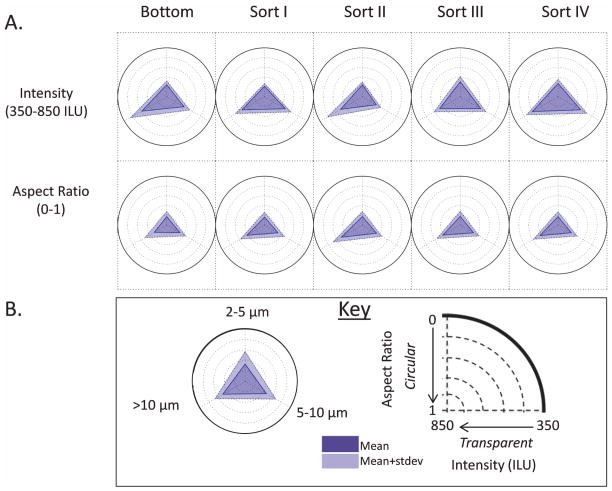
Figure 9.
Radar plots of MFI morphology data (aspect ratio and intensity; refer to the key in B) for subvisible particles of mAb2 present in the starting material for FACS (bottom sample) and FACS sorted samples (sorts I-IV, see text) are shown in A. Radar plots show MFI morphology data distributions of the micron sized particles that fall within each of the three size bins shown in the key of B. The data shown are the average of three separate experiments (N = 3) and the error represents one standard deviation.

