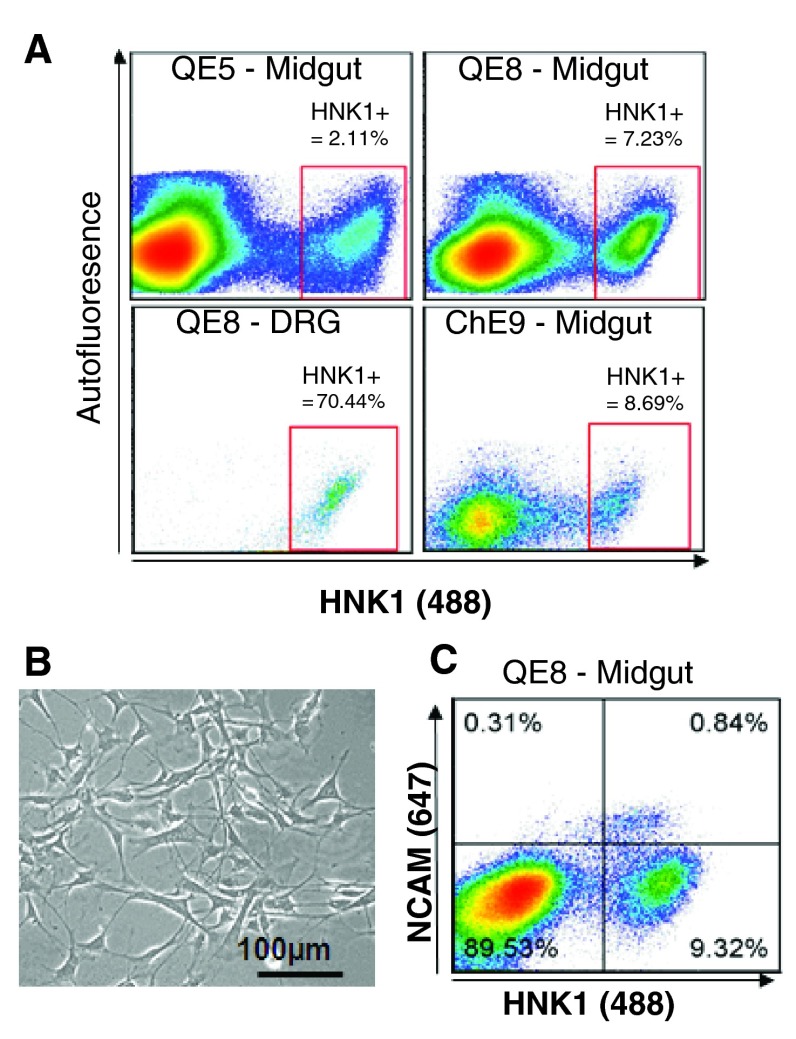
Supplemental Figure S2. FACS of neural crest cells from avian tissue.
Following tissue digestion, single cells were fluorescently labelled with HNK1 and HNK1/NCAM and cells sorted by FACS. ( A) Scatter plots show typical results of sorting embryonic tissue from quail embryonic day 5 (QE5), QE8, and chicken embryonic day 9 (ChE9). The typical percentage yields of HNK1 +ve cells are shown following FACS of single cells from the midgut and dorsal root ganglia (DRG). ( B) QE5 MG HNK1 +ve cells plated on laminin show the characteristic multipolar morphology of ENC cells. ( C) QE8 midguts were digested and single cells fluorescently labelled with HNK1 (Alexa 488) and NCAM (Alexa 647). The scatter plot shows that the majority of NCAM +ve cells also express HNK1. NCAM +ve/HNK1 +ve are able to be differentially sorted from the NCAM -ve/HNK1 +ve population.

