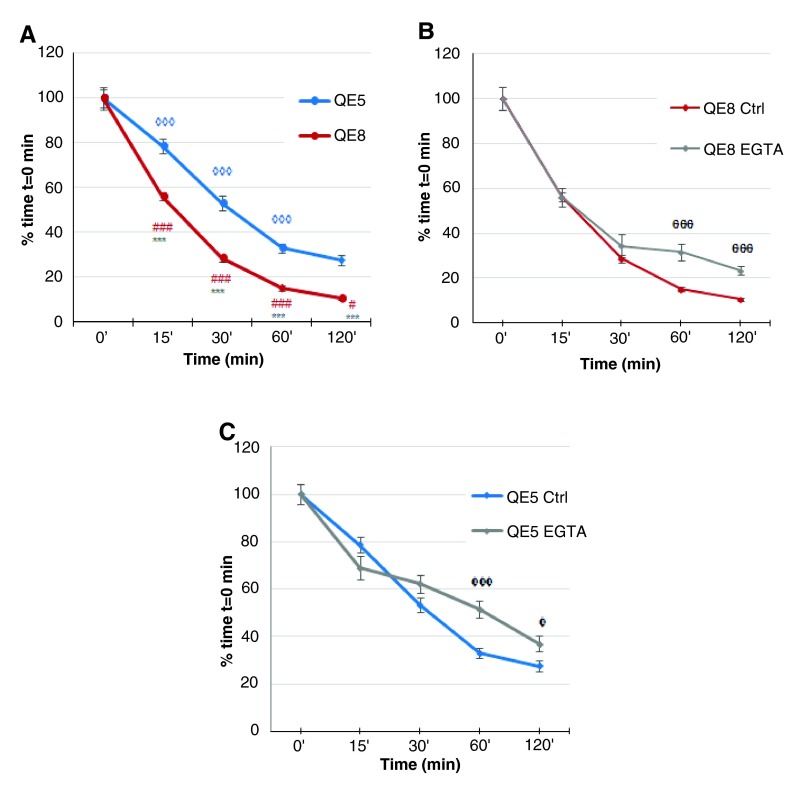
Figure 3. Initial aggregation kinetics of HNK-1 +ve midgut ENS cells are stage and cadherin dependent.
Aggregation was indicated by decrease in particle count and is expressed as % of time t=0 min. A. QE5 and QE8 ENS cells aggregated continuously, with particle count at each time point significantly less than at the previous time point (0 min vs 15 min, 15 min vs 30 min, 30 min vs 60 min and 60 min vs 120 min) (◊◊◊ p<0.001 for QE5; # p=0.0455, ### p<0.001 for QE8), except for QE5 at 60 min vs 120 min, where the particle counts were not significantly different. In addition, aggregation was greater for QE8 ENS cells compared to QE5 ENS cells (*** p<0.001 QE8 vs QE5 at each time point), consistent with a developmentally increasing adhesive capacity. B. With EGTA, early aggregation (0 min, 15 min and 30 min) of QE8 ENS cells proceeded rapidly and was not significantly different from particle counts in control medium at the same time points. At later time points (60 min and 120 min) particle counts with EGTA were significantly greater than from the same time points in control medium (θθθ p<0.001 EGTA vs Ctrl). This strongly indicates that early aggregation events in these assays are largely calcium-independent but after about 30 min aggregation is dependent on cadherin function. C. QE5 ENS cells showed a similar early rate of decline in particle number with EGTA medium at matched time points of 0 min, 15 min and 30 min. Later, particle number decline decreased in EGTA (φφφ, p<0.001 EGTA vs Ctrl at 60 min; φ p=0.0225, EGTA vs Ctrl at 120 min;). This indicates that for QE5 ENS cells early aggregation is largely calcium-independent but further aggregation requires cadherin function. Error bar=SEM.

