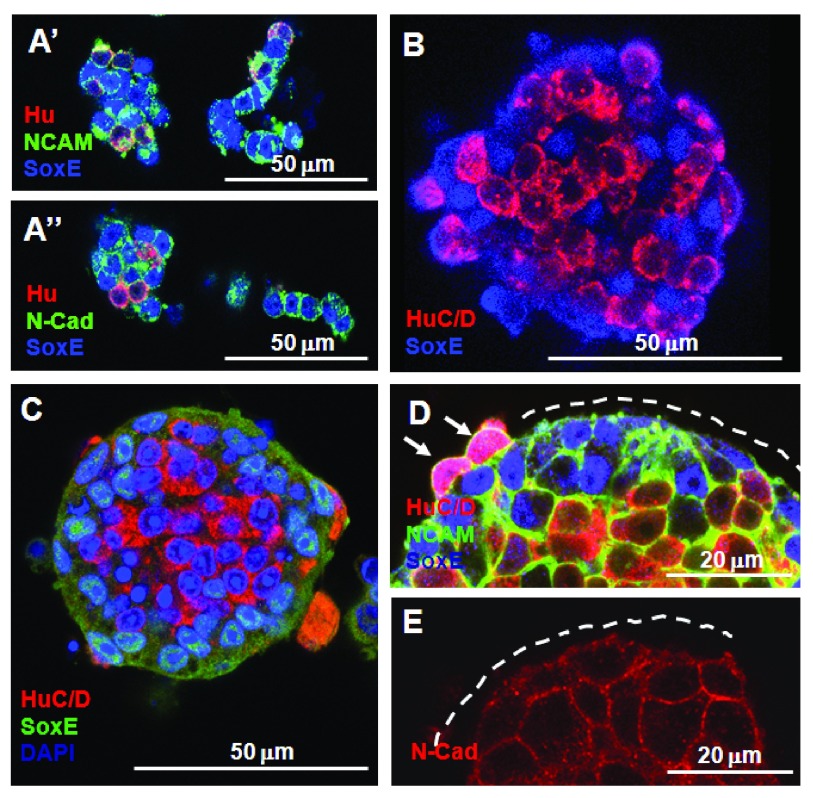
Figure 6. Formation of aggregates by ENS cells in cell-cell adhesion assays correlates with adhesion molecule expression pattern.
A’ A’’. At 2 h QE8 N-cadherin and NCAM +ve ENS cells formed small aggregates (mixed Hu +ve neurons and SoxE +ve ENC cells) and chains (mostly ENC cells). B. At 6 h spherical aggregates were formed but neurons (HuC/D +ve) and ENC cells (SoxE +ve) were only partially segregated. C. At 18 h most HuC/D +ve neurons formed the centre of each spherical aggregate surrounded by SoxE +ve ENC cells. D. NCAM immunoreactivity was low on the external face of SoxE +ve ENC cells (indicated by dotted line), but high around HuC/D +ve neurons, whether these were located centrally or on the periphery (arrows). E. N-cadherin immunoreactivity was associated with all cells in the aggregate, but was less distinct on the external surface (indicated by dotted line).

