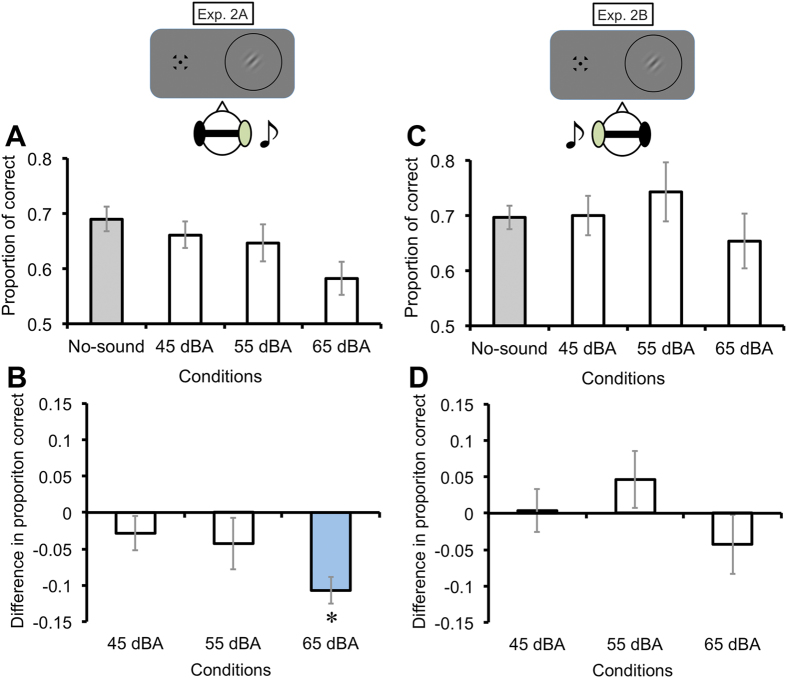
Figure 3.
Effects of spatial congruency (Exp. 2). The visual target was presented at the right side of the display, whereas the sounds were provided to the participant’s right (Exp. 2A: congruent) or left ear (Exp. 2B: incongruent) through headphones. From the proportion correct (A, C), the differences in proportion correct (B, D) were calculated by subtracting the proportion correct in the no-sound condition from each sound condition. Visual orientation discrimination performance was degraded only when the 65-dBA SPL sound was presented spatially congruent with the visual target. Error bars denote the standard error of the mean (N = 7). An asterisk indicates the sound condition significantly different from the baseline (the no-sound condition) (p < .05).

