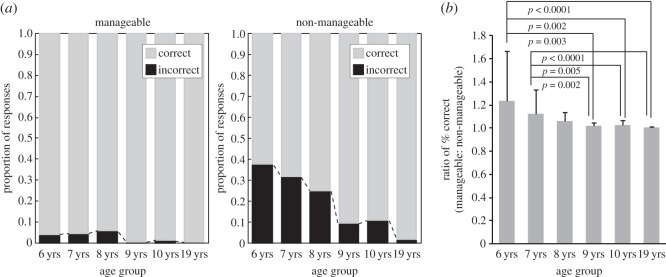
Figure 5.

Proportion of frequencies of correct and incorrect responses. Manageable angles for the left hand were 45°, 90° and 135° (those for the right hand were 315°, 270° and 225°), and non-manageable angles were mirror-reversed. (a) In each age group, more errors were made for non-manageable angles than manageable angles. (b) Group differences in the strength of biomechanical constraints are shown by the manageable:non-manageable ratio of (1−error rate).
