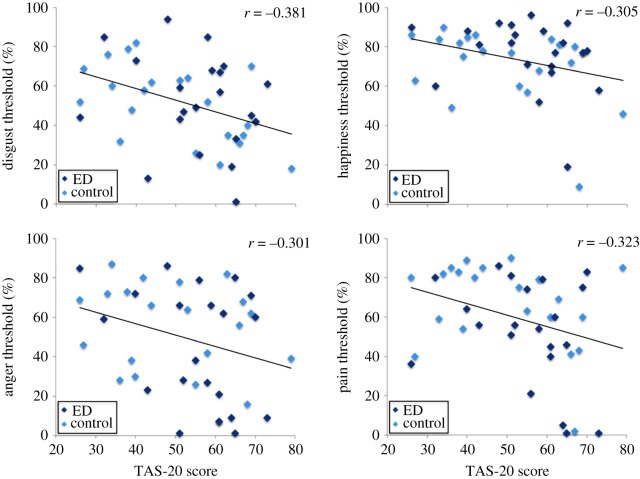
Figure 2.
Scatter plots with best-fitting regression lines showing recognition thresholds for disgust, happiness, anger and pain recognition. Recognition thresholds are shown for individuals in the eating disorder and control groups, as a function of their score on the Toronto alexithymia scale (TAS-20). A greater score on the TAS-20 indicates more severe levels of alexithymia.

