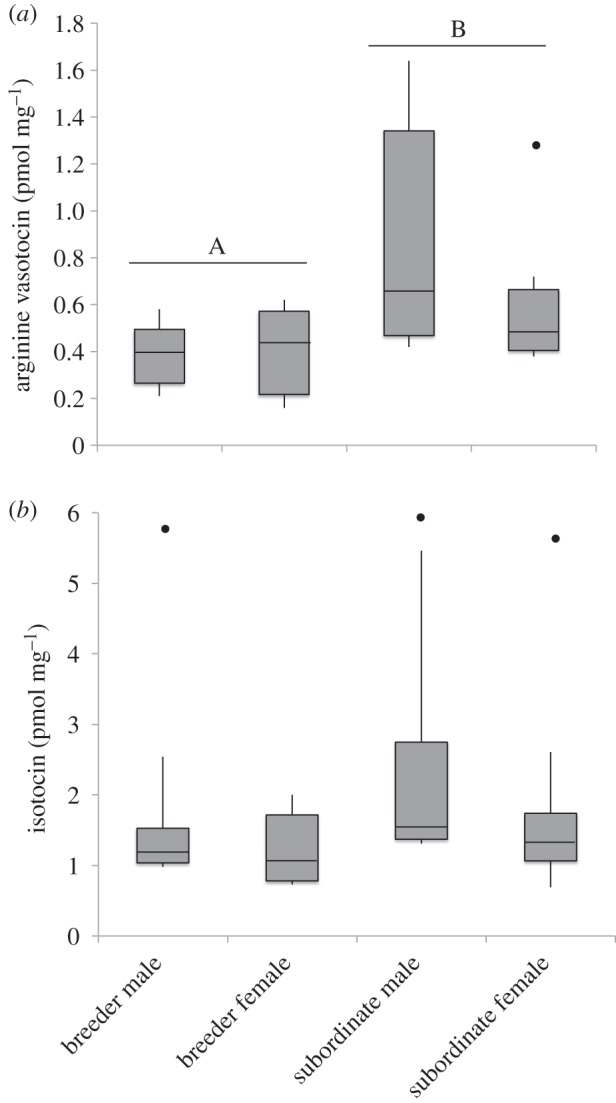
Figure 1.

The relationship between (a) brain arginine vasotocin (AVT) and (b) brain isotocin (IT) concentration, and sex and dominance status in Neolamprologus pulcher. Subordinate N. pulcher have higher brain AVT concentrations. Boxes represent the interquartile range (i.e. the 25th–75th percentile) of the data, with the median denoted by the band inside the box. Whiskers represent the 10–90th percentile of the data. Outliers are indicated. For sample sizes, see table 1. For full statistical details, see table 3.
